"Trainalyse is your mobile training anlysis tool"
Trainalyse is not about recording; it’s about in-depth analysis!
Use your GPS enabled sports watch or your favorite recording app for recording your running, biking, swimming, ….
Afterwards, use Trainalyse to analyse your performance. Simply import the FIT/TCX/GPX file and dive into in-detail map, plot, and statistic representations of all recorded measures. Finally, monitor your progress via aggregated statistics over time.
This is the free lite version of Trainalyse. It is limited with regards to the amount of activities and the configurability of the zones and segments views!
"Analyse your sport"
Trainalyse supports lots of sports: running, biking, swimming, hiking, inline skating, skiing, surfing and many more.
"Analyse your existing recordings"
Recorded activities can be imported via Dropbox, iTunes, on the device from other recoding apps (via “open with”) or directly from certain GPS-Watches (via ANT-FS, ANT dongle required). Supported are the common activity file formats TCX, GPX and FIT; with support for many measures: heart rate, cadence, slope, power, strokes, step length, vertical oscillation, …
"Optimized for mobile devices"
Trainalyse is an activity analysis tool build from ground up for the mobile screen. It brings the rich experience of a desktop training analysis app to the mobile screen. The content adapts to the screen, if horizontal or vertical, no need to scroll endlessly to find the desired detail, as it is common in web-portals. And all this without sacrificing configurability: hidden menus that nicely slide in are only one click away to provide you full configurability.
"Extensive configurability"
Trainalyse is extremely configurable to your needs and your current performance level. You can for example change performance zones for each measurement individually per sport: E.g. set your favorite coloring for your optimal speed range while running!
And you can configure so much more: Visible measures in plot, plot over time v.s. plot over distance, the measure visualized on the map, the length of segments in the segments statistics, …
"Keep your data local, be independent of connectivity"
Trainalyse keeps all data on your device, no Internet connectivity required. This has three advantages:
- First, it’s fast, activities show up in an instant when you select them.
- Second, if you want to, you can operate independent of cloud services, keeping your data private.
- Third, the independence of connectivity makes it ideal for situation where you have slow Internet or for training camps abroad …
"Lots of features"
Trainalyse provides lots of features to analyse your sport data:
- List of activities with key facts (distance, speed, heart rate, rpm, ascent, …)
- Activity analysis (Plot, Map, Segments, Zones)
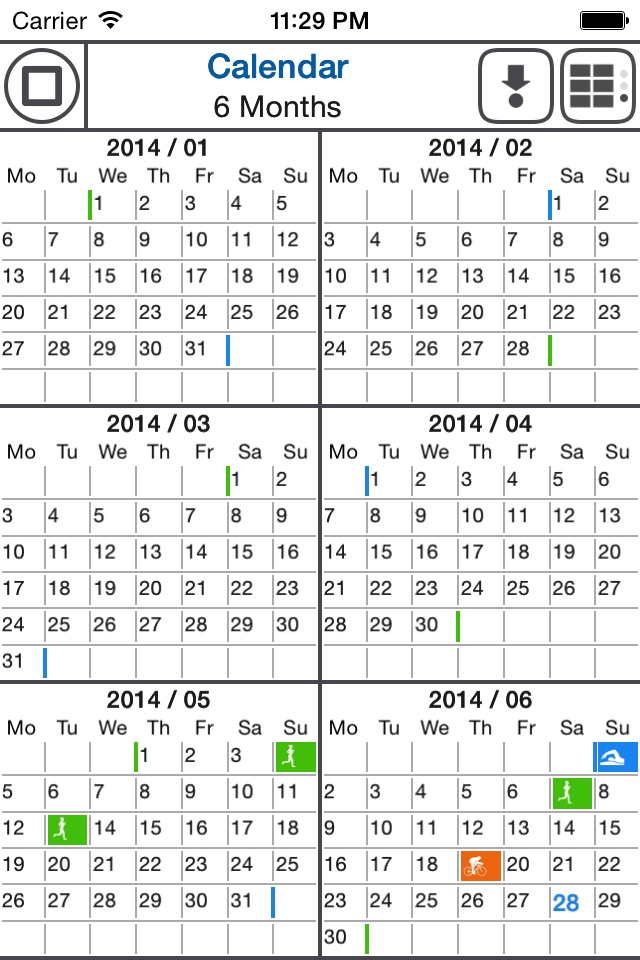
- Calendar (Weeks, Months, …)
- Summary-Overview (last year, month, week)
- Yearly, monthly, weekly summaries for individual sports
- Import files from Dropbox, ANT-FS enabled watches, “Open with”, iTunes
- Manually add activities
- Share your analysis via Facebook, Twitter, WhatsApp, Mail, …
- Fully configurable: zones, zone colors, plot dimensions, measures in plot, plot over time/distance, measure on map, segment length, …


